This tool is a model that uses variables to predict the presence of aquatic invasive plants. The model predicts the likelihood that a 10 meter by 10 meter area has invasive plants on a scale of 50% probable to 100% probable. For full details on model development and accuracy read our report.
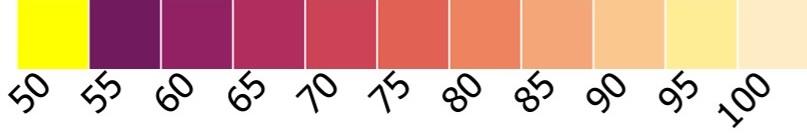
Map Legend: AIS Probability (%)
How to use the prediction tool:
- Pan and zoom to a waterbody of interest. The map will display all areas with a predicted likelihood of invasive plants between 50-100%.
- Use the slider bar at the top-right of the map to focus in on the most likely locations for invasive plants to establish. We recommend increasing the lower end of the percent scale to the 75-80% to reduce the areas displayed. These are the hotspots to look closely at. NOTE: The map symbology will change to a single symbol when the filter is applied.
- Review the map and note the general areas that are highlighted. Do not worry about the specific 10 by 10 meter pixels, but look at the overall areas highlighted (a bay or a shoreline section).
- When out on the water spend some extra time checking these locations. Maybe this means extra rake tosses or using multiple techniques like snorkel surveys and eDNA.
- Submit observations of invasive species to iMapInvasives
For more information about this tool, contact APIPP.